


The GAP Index: An Important Measure for Our Future
Sister Quincy Howard, OP
May 21, 2019
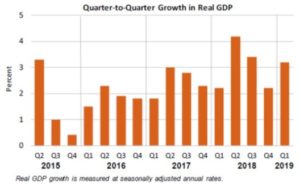
Did you hear the great news? At the end of April the Bureau of Economic Analysis (BEA) released its “advance” estimate of economic growth for the first quarter of 2019: Real gross domestic product (GDP) increased 3.2 percent!1 To put that in perspective, in the last quarter of 2018, real GDP only increased 2.2 percent. So by all accounts, the U.S. economy is thriving and strong, right? Not exactly.
BEA produces some of the most closely watched economic statistics that influence decisions of government officials, business people, and individuals. The most familiar and hackneyed is the GDP—it provides a great talking point but minimal insights for policymakers. Nonetheless, policy decisions continue to be based on promised GPD growth gains.
The problem is that the real GDP measurement doesn’t comprise “all accounts.” This single top-line number conceals a less-rosy and complicated reality in which the richest three Americans hold more wealth than the bottom 50% of the country. While CEO pay rose 8 percent on average in 2018 to $7.4 million, the average median wages for employees at the same companies stayed about the same. And the CEOs made about 150 times what a typical worker did last year.2
GDP measures national economic growth, which combines inputs like jobs, savings, business opportunity, consumption and profits into such a macro-level snapshot that it has little significance for the daily, lived reality of average people.
Overdependence on GDP as the primary measure of our economic health is not only misleading, it distracts us from arguably more pressing issues. The pervasive and damaging myth that “growth is always good” relegates economic inequality as an unfortunate feature of economic growth or, even worse, as a necessary side effect. This myopic focus on maintaining endless growth even at the expense of the lived reality has damaging implications. In Laudato Si, Pope Francis posits that the near exclusive focus on economic growth and ever-increasing consumption as solutions to social problems is a fundamental cause of global crisis and economic injustice.
NETWORK hosted “Town Halls for Tax Justice” during our Nuns on the Bus tour in 2018. To begin the town halls, Sisters role-played individuals along the spectrum of income (one character, Diana, was among the lowest 20% of income earners while another, George, was in the top 1% of earners). After introducing themselves and talking about their financial hopes and concerns, each character took steps forward (or backward) based on how much their income bracket experienced growth over the past 35 years. The physical gap between the richest and poorest widened significantly based on the economic impacts of trickle-down policies since the 1980s. Then each character took additional steps depending on the tax return that they could anticipate under the 2017 Tax Law, creating an even larger divide.
According to audience feedback, these Town Halls were eye-opening and impactful—the breakdowns demonstrated how policies are making the rich richer while the poor and middle class fall further and further behind. We need our government to begin quantifying and regularly reporting on these dynamics of economic growth. With the data analysis capabilities available to us in the 21st Century there’s no reason we cannot have a meaningful economic measure generated to capture this each quarter.
GDP 2.0—what NETWORK calls the “GAP Index”—is a campaign to change how the United States reports economic progress. Instead of a one-number release, the U.S. Bureau of Economic Analysis might instead release four or more numbers describing growth for those at different levels of income. Eventually, the agency might also break down growth benefits by demographic or geographic characteristics. Such quarterly reports would dramatically change the narrative around economic growth and stability by refocusing our statistics on the lived experience of the average individual or family in the United States.
The U.S. Government already has the necessary data; three simple policy fixes would enable the BEA to generate GDP 2.0 data and report it on a quarterly basis:
- Require BEA to include distributional breakdowns in its aggregate income tables.
- Make IRS tax return data accessible to the BEA under section 6103(j)(B) of the tax code.
- A small increase in BEA funding to create capacity for these new statistics.
Congress is working on dual tracks to make this a reality: legislatively and via the appropriations process. Legislatively, The Measuring Real Income Growth Act has been sponsored by Senators Chuck Schumer and Martin Heinrich as well as Representative Carolyn Maloney. Concurrently, there are efforts to incorporate the recommended policy fixes into the Commerce, Justice and Science appropriations legislation which ultimately funds the BEA.
Having a quarterly Gap Index could have profound political impacts, because the new data will enable economists, interest groups, and scholars to produce studies showing how various groups are faring as the economy grows. Richer economic measures like GDP 2.0 allow law-makers and advocates like NETWORK to more clearly show how policies diminish or contribute to inequality in our nation.